
88 Must-Know Travel Statistics by Age Group for 2024
After years of travel restrictions, the hospitality and travel industry bounced back thanks to record-breaking travel spending. Of course, not all travelers are interested in the same kind of experience. Road trips, international travel, and weekend getaways appeal to different people. However, one factor can dramatically change travel preferences: age.
Whether you want to keep up with trends or find inspiration for your next trip, we’ve compiled a list of travel statistics by age group to show you how different generations travel solo and together. We’ll also share statistics about destinations, methods, reasons for travel, and accommodation preferences.
Travel Statistics by Age Group
While baby boomers prefer to use all of their vacation days, millennials aren’t afraid to dip into debt to plan their dream trip. Read on to learn how age impacts travel in today’s post-pandemic landscape.
Baby Boomer Travel Statistics
Thanks to their established careers, baby boomers have the resources to travel longer and more often. Here are the specifics:
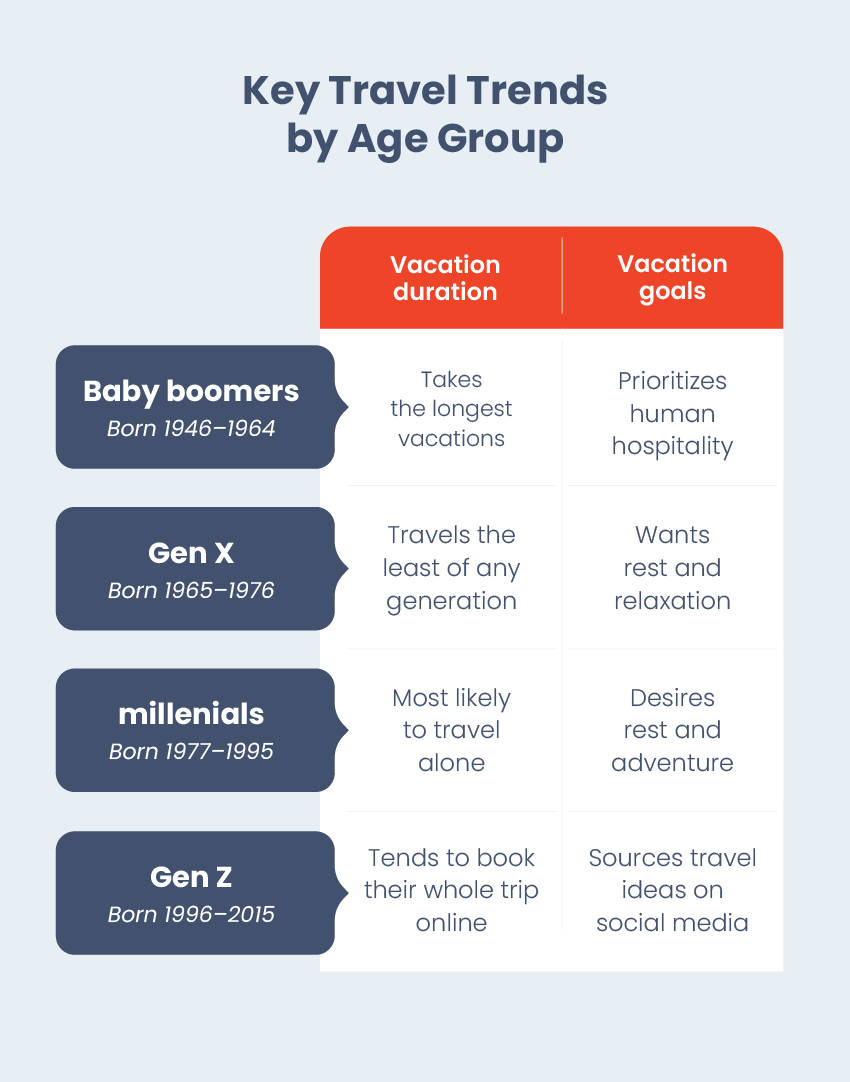
- Baby boomers’ vacations typically last a week or more, the longest of any generation (Expedia).
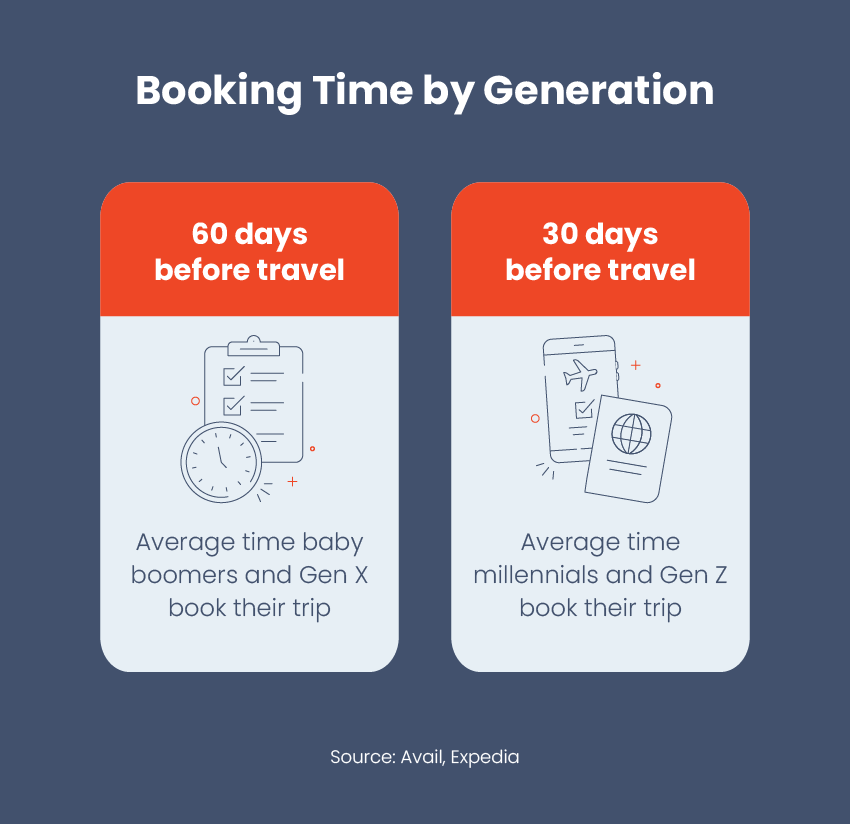
- Baby boomers take the most time to plan their trips, often booking months in advance (Expedia).
- Only 66% of baby boomers believe it’s important to book your entire trip online, less than any other generation (Hilton).
- Baby boomers expected to take an average of four to five trips in 2023 (AARP).
- 54% of baby boomers let environmental changes factor into travel planning, less than any other generation (Hilton).
- 25% of baby boomers look for hotels advertising quality mattresses for a good night’s sleep (Hilton).
- 86% of baby boomers seek out local and regional cuisine when traveling (Hilton).
- Baby boomers are more than twice as likely as other generations to prioritize the human factor in hospitality over technology services (Hilton).
- 62% of baby boomers prioritize using all of their vacation days each year (AARP).
- 59% of baby boomers refuse to bring work with them on trips (AARP).
Gen X Travel Statistics
Gen X travelers often balance careers and family obligations with their travel plans. With that in mind, here are some statistics on Gen X travel:
- Gen X plans to travel the least, with only 76% of Gen Xers planning to increase or maintain their travel levels from previous years. By comparison this number jumps to 77% for baby boomers, 79% for Gen Z, and 84% for Millennials (Avail).
- 68% of Gen Xers list rest as their main reason to travel, more than any other generation (Hilton).
- 45% of Gen X travelers prioritize restaurants and culinary experiences when traveling (Hilton).
- Gen X takes an average of 17.9 days off a year and dedicates 8.2 of those to travel (U.S. Travel Association).
- 79% of Gen X expect their personal devices to work when traveling (Hilton).
- 84% of Gen X say they want to experience something new when traveling (Hilton).
- 78% of Gen X say they want to feel pampered and taken care of while traveling (Hilton).
Millennial Travel Statistics
Here are some of the top millennial travel and vacationing statistics:
- 65% of millennials save money specifically for travel (Expedia).
- 42% of millennials have traveled alone, more than any other generation (Expedia).
- 27% of millennials have posted about their trip plans on social media to source opinions before booking (Expedia).
- Two-thirds of millennials turn to social media for food recommendations when traveling (American Express).
- 22% of millennials pack a favorite pillow for more comfort when traveling (Hilton).
- 37% of millennials want a wellness-focused travel experience (Hilton).
- While 60% of millennials want to rest and recharge when traveling, 52% still want an element of exploration and adventure (Hilton).
- Millennials seek out diverse travel experiences—33% prioritize cultural events, 30% want live music experiences, and 26% want to attend sporting events (Hilton).
- 84% of millennials want to increase or maintain their travel levels from previous years, more than any other generation (Avail).
- 77% of millennials try to use all of their vacation time each year (AARP).
- 78% of millennials bring their work with them on trips (AARP).
- Millennials are the most willing generation to take on debt for travel (Travel Pulse).
- 23% of millennials report meeting fellow travelers as a main reason to take trips (WYSE Travel Confederation).
- 45% of millennials take trips to learn more about themselves (WYSE Travel Confederation).
Gen Z Travel Statistics
While many Gen Zers haven’t reached adulthood, trends have begun around the ways they travel.
- 74% of Gen Z travelers like to bundle their entire trip’s reservations and services with their hotel bookings entirely online (Hilton).
- 75% of Gen Z says QR codes improved their dining experiences when traveling (Hilton).
- 11% percent of Gen Z have delayed a breakup with a significant other to go on a planned trip (Expedia).
- 81% of Gen Z travelers feel obligated to text significant others or their families before a flight takeoff and after landing (Expedia).
- 36% of Gen Z base their travel destinations on places they saw on social media (Expedia).
- 71% of Gen Z report they would get a part-time job to save money needed for a trip (Expedia).
- Gen Z is the most intentional about winding down for a good night’s sleep when traveling, with 25% avoiding alcohol before bed and 21% regulating their workout routine (Hilton).
Reasons for Travel Statistics
Different generations travel for different reasons. Here are a few statistics showing how:
- Gen Z travelers prefer travel experiences involving exploration, adventure, and trying new activities (Expedia).
- Baby boomers prioritize sightseeing, touring, and traditional travel experiences (Expedia).
- Millennials and Gen X travelers are most likely to use travel as a way to relax (Expedia).
- 74% of travelers fulfilled travel expectations over low costs (American Express).
- 78% of travelers see leisure travel as a budgeting priority (American Express).
- 48% of travelers like destinations they can show on social media (American Express).
- 64% of travelers have been inspired to try a destination after seeing it on a TV show, movie, or news segment (American Express).
- 57% of travelers take vacations to prioritize wellness (American Express).
Destination Travel Statistics
Different generations prioritize different destinations. Review these area tourism statistics to understand how:
- In the next year, 69% of American travelers want to vacation in the United States. By contrast, 12% prefer international trips (Avail).
- New York City remains the most popular domestic destination, followed by Orlando and Las Vegas (Hopper).
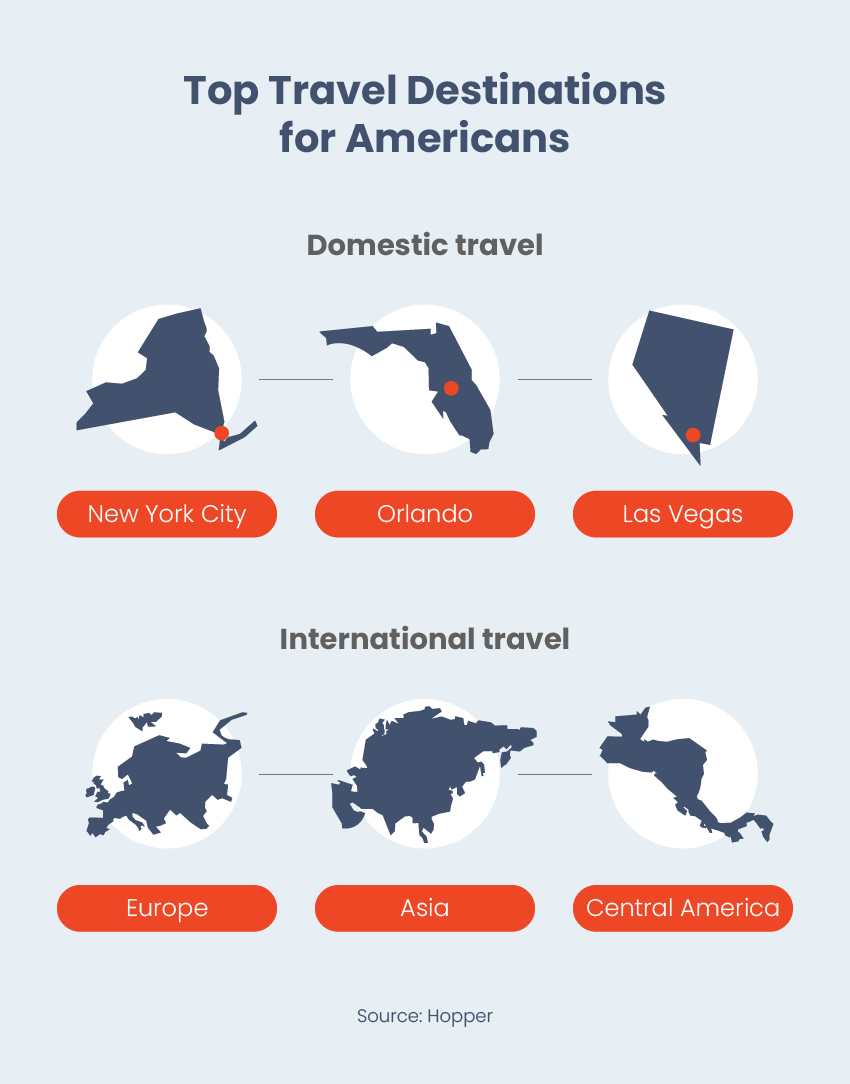
- Europe is the highest-demand international travel destination for Americans, followed by Asia (Hopper).
- Warm weather destinations, including Mexico, the Antilles, and various Central American countries, create 20% of international search demand in the U.S. (Hopper).
- 19% of Americans would consider domestic and international travel in the next year (Avail).
- 59% of Americans plan to stay in a hotel during their upcoming trip (Avail).
- 89% of travelers want to visit destinations they’ve never been to before (American Express).
Spending and Cost of Travel Statistics
Your age and income play a key role in travel spending. Discover how:
- 57% of Americans currently save money for travel (Expedia).
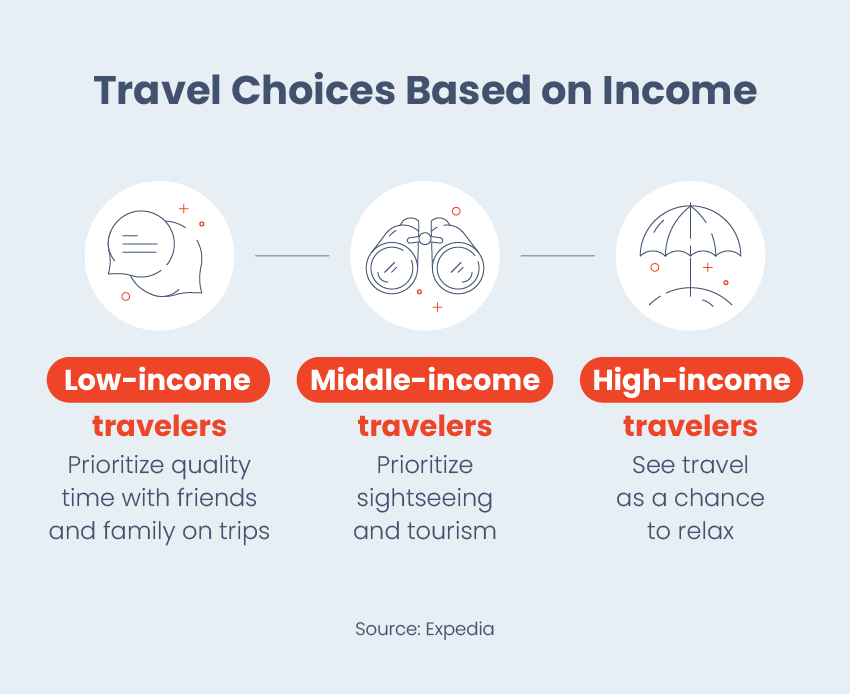
- Low-income travelers prioritize quality time with friends and family on trips, and middle-income travelers prioritize sightseeing and tourism. The highest earners see travel as a chance to relax (Expedia).
- 49% of millennials and Gen Zers would sell clothes or furniture to afford a trip (Expedia).
- Cost plays the largest role in shaping travel decisions, with 61% reporting it has the greatest impact on their plans (Avail).
- 84% of Americans paid more for travel in 2023 than 2022. This increase stems from rising costs and more frequent travel (Hopper).
- Travelers who fly midweek save an average of $90 on domestic flights and over $140 on international trips (Hopper).
Method of Travel Statistics
Here are a few statistics on how different age groups prefer to travel:
- Personal vehicles, flights, and rental cars top the list of preferred methods for reaching a destination (Avail).
- Most travelers prefer driving or walking when traveling around their destination (Avail).
- Younger travelers show the most interest in using car or bus sharing to reach their destination, especially when it cuts down on costs (Avail).
- Air travel demand grew 12% in summer 2023 compared to summer 2022 (U.S. Travel Association).
- In 2023, the number of passengers going through Port Everglades, one of the busiest cruise ports in the world, was 77% higher compared to 2022 (NPR).
Booking and Accommodation Travel Statistics
Where and when you book accommodations correlates to age in a few key ways:
- 90% of travelers plan to book a vacation in the next 12 months, with the majority claiming COVID-19 has not impacted their sense of safety enough to change travel plans (Avail).
- 33% of Gen Z travelers will pass on a hotel because it doesn’t offer free internet access (Expedia).
- Millennials and Gen Zers prefer to book vacations over long weekends that last three to five days (Expedia).
- Younger generations usually book accommodations less than 30 days in advance (Expedia).
- Older travelers prefer to book accommodations about two months before their trip (Avail).
- 80% of Americans prefer to book all their accommodations, rentals, flights, and reservations on one website. That number jumps up to 87% for Gen Z (Expedia).
- Half of Gen Z and 48% of millennials prefer to book transportation and accommodations by visiting an online travel agency (Expedia).
- Personal finances and travel expenses play the largest role in booking and accommodation decisions. However, Gen Z is the only group to prioritize safety and security over cost when booking accommodations (Avail).
- Hotels are the most common accommodation travelers book when planning trips. Staying with friends and family comes second (Avail).
- 38% of travelers prioritize booking with extra deals or free upgrades to their accommodations (Expedia).
- 35% of travelers made travel plans where they stayed in one- to three-star hotels in 2023 (Expedia).
Group Travel Statistics
Some new trends in group travel have emerged in the past few years. To highlight these changes, consider the data on travel with family, friends, and coworkers.
Family Travel Statistics
When looking at the ways families travel together, keep these statistics in mind:
- Gen Z is the most likely generation in adulthood to travel with their parents, with 54% reporting they usually or always travel with family (Expedia).
- 58% of Gen Z travelers report their parents paid for trip expenses when they traveled together in the past year (Expedia).
- 24% of millennials report their parents pay for travel costs when they vacation together (Expedia).
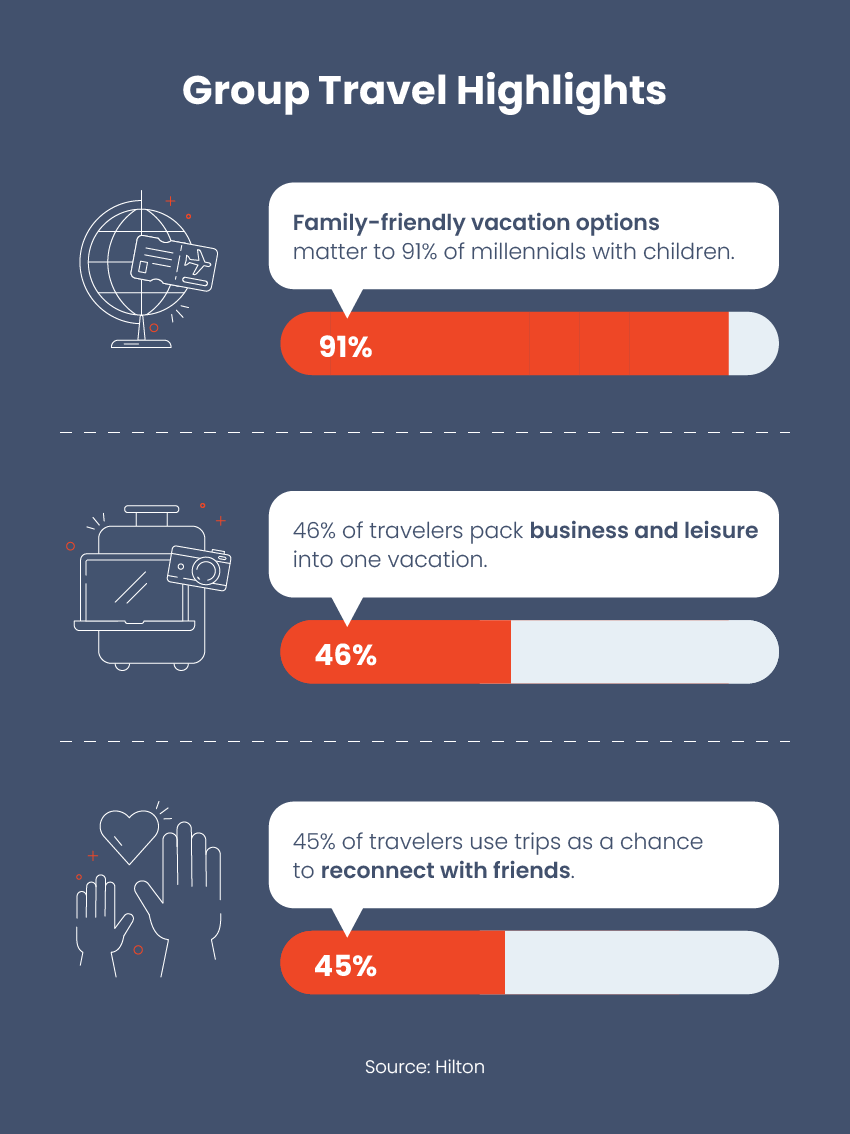
- Family-friendly travel options are a high priority for 91% of millennial parents (Hilton).
Work Travel Statistics
Whether it’s for business or business and leisure, here are a few statistics on work travel:
- 52% of remote workers report their work flexibility affects how they plan business and personal trips (Hopper).
- 1 in 3 Hopper users have traveled or expect to travel for work in the next year (Hopper).
- 46% of full-time or self-employed workers travel for business and leisure, or “bleisure.” (Hilton).
- Over 1 in 3 millennials and gen Z workers plan to extend work vacations for more leisure time before or after business obligations (Hilton).
Friend Group Travel Statistics
Here are a few data points about how friends travel together:
- Over half of travelers booking rentals with their friends report amenities are one of the most important criteria (Expedia).
- 38% of travelers cook to cut down on vacation costs (Expedia).
- 41% of friends traveling together cook shared meals to bond as a group (Expedia).
- 46% of friend groups traveling together make dining reservations before booking their trip (American Express).
- 45% of travelers use travel as a means to reconnect with friends (Hilton).
How Age Affects Travel
While age doesn’t have a one-to-one effect on how people travel, these statistics show a few key correlations. Here are some of the most significant points:
- Duration of trips: Baby boomers and Gen X have more to spend on traveling, largely because they’re more established in their careers. As a result, older generations tend to take longer trips than millennials or Gen Z.
- Working while traveling: millennials are more likely to work while traveling than Gen X or baby boomers. Because their trips are shorter and more spontaneous, this allows them to take a trip without taking too much PTO.
- Cost of trips: There’s a direct correlation between age and the amount travelers are willing to spend for their trips. While millennials and Gen Z are happy to save or take on a part-time job, baby boomers still spend the most on their vacations.
- Travel destinations: Because far-away destinations cost more to reach, older generations travel abroad more often. That said, domestic travel is popular among all generations.
- Solo and group travel: Younger generations have a greater interest in traveling alone. They are also interested in adventurous experiences that don’t suit family trips and that they can book at the last minute. As a result, solo travel is on the rise.
Plan Your Next Trip With GOGO Charters
Even after years of turbulence, every generation still wants the chance to travel by air, car, or bus. While each generation travels differently, reviewing these travel statistics by age group reveals a few common threads. Whether you’re trying to go abroad or have a weekend getaway, the chance to travel is well worth the investment.
To help you get where you’re going, try GOGO Charters. Our fleet includes minibus and charter bus rentals that suit every occasion, from family reunions to corporate retreats, by offering customization to fit your needs.